

서비스를 배포하기에 앞서 예상되는 상황을 테스트하여, 현재 시스템이 어느 정도의 부하를 견딜 수 있는지 확인하고. 한계치에서 병목이 생기는 지점을 파악하고 장애 조치와 복구를 사전에 계획해둘 필요가 있습니다.
성능이란 무엇인지, 그리고 성능 테스트를 어떻게 설계해야하는지 등은 강의를 통해 확인할 수 있어요.
1. 성능 테스트 도구
성능 테스트 도구로는 Apache JMeter, nGrinder, Gatling, Locust, K6 등이 알려져있습니다.
•
시나리오 기반의 테스트가 가능해야 합니다. (Apache JMeter는 단순히 일정량의 API를 요청하는 것으로, 로그인한 사용자의 요청 등의 시나리오를 구성하는데 한계가 있습니다.)
•
동시 접속자 수, 요청 간격, 최대 Throughput 등 부하를 조정할 수 있어야 합니다.
•
부하 테스트 서버 스케일 아웃을 지원하는 등 충분한 부하를 줄 수 있어야 합니다. (k6 standalone 방식은 지원하지 않습니다.)
A. nGrinder
a. nGrinder Controller 설치
$ sudo apt update
$ sudo apt install default-jre
$ sudo apt install default-jdk
$ wget https://github.com/naver/ngrinder/releases/download/ngrinder-3.5.8-20221230/ngrinder-controller-3.5.8.war
$ nohup java -jar ngrinder-controller-3.5.8.war &
Shell
복사
•
초기 비밀번호는 id: admin, pw: admin 입니다.
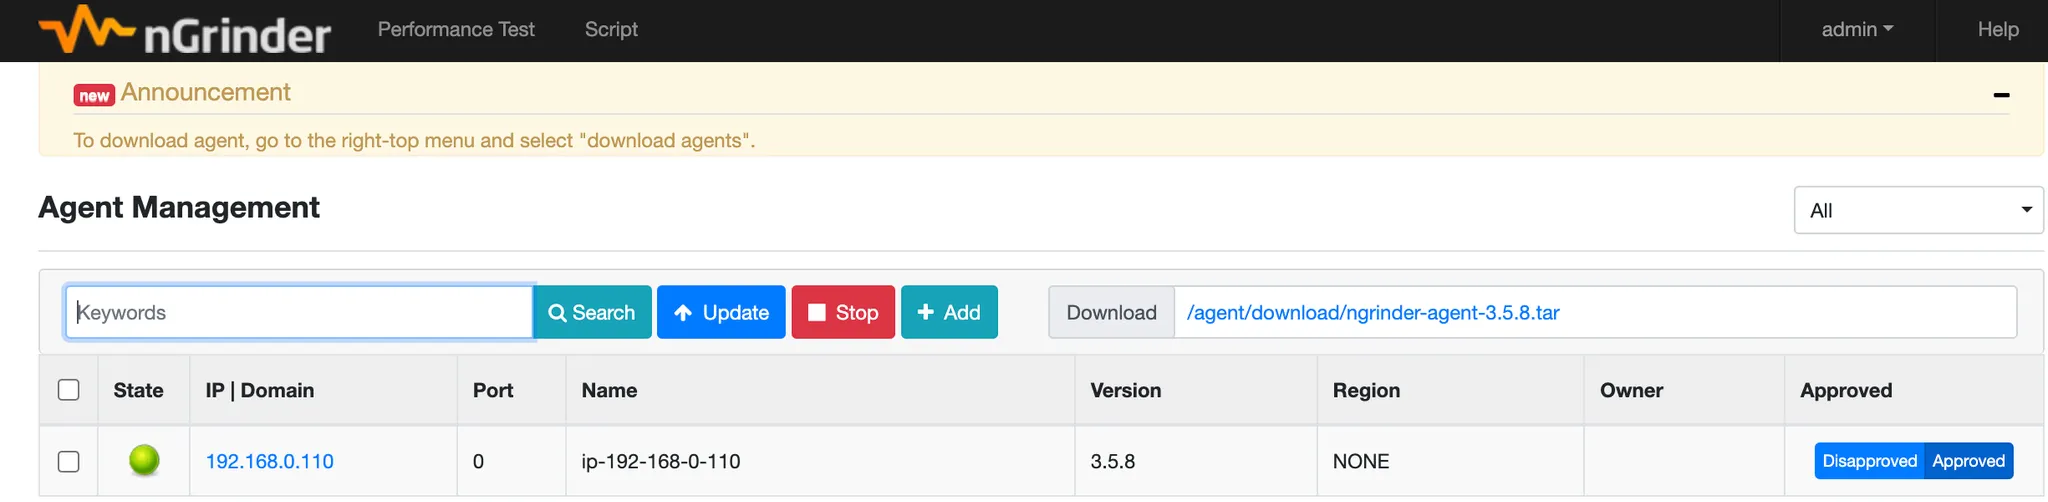
b. Agent 설치
Agent를 설치하려는 서버에서 진행합니다.
$ sudo apt update
$ sudo apt install default-jre
$ sudo apt install default-jdk
$ wget http://[Controller Internal IP]:8080/agent/download/ngrinder-agent-3.5.8.tar
$ tar -xvf ngrinder-agent-3.5.8.tar
$ cd ngrinder-agent
$ vi __agent.conf
Shell
복사
common.start_mode=agent
agent.controller_host=[Controller Internal IP]
agent.controller_port=16001
agent.region=NONE
Bash
복사
# 포그라운드로 실행 (로그 확인)
$ ./run_agent.sh
# 백그라운드로 실행
$ ./run_agent_bg.sh
Shell
복사
c. 스크립트 작성
import static net.grinder.script.Grinder.grinder
import static org.junit.Assert.*
import static org.hamcrest.Matchers.*
import net.grinder.plugin.http.HTTPRequest
import net.grinder.plugin.http.HTTPPluginControl
import net.grinder.script.GTest
import net.grinder.script.Grinder
import net.grinder.scriptengine.groovy.junit.GrinderRunner
import net.grinder.scriptengine.groovy.junit.annotation.BeforeProcess
import net.grinder.scriptengine.groovy.junit.annotation.BeforeThread
// import static net.grinder.util.GrinderUtils.* // You can use this if you're using nGrinder after 3.2.3
import org.junit.Before
import org.junit.BeforeClass
import org.junit.Test
import org.junit.runner.RunWith
import java.util.Date
import java.util.List
import java.util.ArrayList
import HTTPClient.Cookie
import HTTPClient.CookieModule
import HTTPClient.HTTPResponse
import HTTPClient.NVPair
/**
* A simple example using the HTTP plugin that shows the retrieval of a
* single page via HTTP.
*
* This script is automatically generated by ngrinder.
*
* @author admin
*/
@RunWith(GrinderRunner)
class TestRunner {
public static GTest test
public static HTTPRequest request
public static NVPair[] headers = []
public static NVPair[] params = []
public static Cookie[] cookies = []
@BeforeProcess
public static void beforeProcess() {
HTTPPluginControl.getConnectionDefaults().timeout = 6000
test = new GTest(1, "[테스트 대상 도메인]")
request = new HTTPRequest()
// Set Cookie Datas
List<Cookie> cookieDatas = new ArrayList<Cookie>()
cookieDatas.add(new Cookie("[쿠키 헤더]", "[쿠키 값]", "[테스트 대상 도메인]", "[테스트 대상 URL]", new Date(32503647599000L), false))
lse))
cookies = cookieDatas.toArray()
grinder.logger.info("before process.");
}
@BeforeThread
public void beforeThread() {
test.record(this, "test")
grinder.statistics.delayReports=true;
grinder.logger.info("before thread.");
}
@Before
public void before() {
request.setHeaders(headers)
cookies.each { CookieModule.addCookie(it, HTTPPluginControl.getThreadHTTPClientContext()) }
grinder.logger.info("before thread. init headers and cookies");
}
@Test
public void test(){
HTTPResponse result = request.GET("[테스트 대상 도메인]+[테스트 대상 URL]", params)
if (result.statusCode == 301 || result.statusCode == 302) {
grinder.logger.warn("Warning. The response may not be correct. The response code was {}.", result.statusCode);
} else {
assertThat(result.statusCode, is(200));
}
}
}
Groovy
복사
B. K6
k6 standalone 방식은 scale out을 지원하지 않아, 성능 테스트 도구로는 적합하지 않아요. 다만, javascript로 스크립트를 짤 수 있고 구성이 간단하니 간단히 성능테스트하고 싶다면 대안이 될 수는 있어요. 이 후 k6 cloud를 활용해보세요.
a. k6 설치
$ sudo apt-key adv --keyserver hkp://keyserver.ubuntu.com:80 --recv-keys C5AD17C747E3415A3642D57D77C6C491D6AC1D69
$ echo "deb https://dl.k6.io/deb stable main" | sudo tee /etc/apt/sources.list.d/k6.list
$ sudo apt-get update
$ sudo apt-get install k6
Shell
복사
b. 스크립트 작성
$ k6 run smoke.js
Shell
복사
# smoke.js
import http from 'k6/http';
import { check, group, sleep, fail } from 'k6';
export let options = {
vus: 1, // 1 user looping for 1 minute
duration: '10s',
thresholds: {
http_req_duration: ['p(99)<1500'], // 99% of requests must complete below 1.5s
},
};
const BASE_URL = '[Target URL]';
const USERNAME = 'test id';
const PASSWORD = 'test password';
export default function () {
var payload = JSON.stringify({
email: USERNAME,
password: PASSWORD,
});
var params = {
headers: {
'Content-Type': 'application/json',
},
};
let loginRes = http.post(`${BASE_URL}/login/token`, payload, params);
check(loginRes, {
'logged in successfully': (resp) => resp.json('accessToken') !== '',
});
let authHeaders = {
headers: {
Authorization: `Bearer ${loginRes.json('accessToken')}`,
},
};
let myObjects = http.get(`${BASE_URL}/members/me`, authHeaders).json();
check(myObjects, { 'retrieved member': (obj) => obj.id != 0 });
sleep(1);
};
JavaScript
복사
ramp-up 구간 구성
export let options = {
stages: [
{ duration: '1m', target: 500 }, // simulate ramp-up of traffic from 1 to 100 users over 5 minutes.
{ duration: '2m', target: 500 }, // stay at 100 users for 10 minutes
{ duration: '10s', target: 0 }, // ramp-down to 0 users
],
thresholds: {
http_req_duration: ['p(99)<1500'], // 99% of requests must complete below 1.5s
'logged in successfully': ['p(99)<1500'], // 99% of requests must complete below 1.5s
},
};
Shell
복사
c. 대시보드 구성
•
influx db 설치
◦
influx db 는 8086 포트를 점유합니다.
$ sudo apt install influxdb
Shell
복사
•
grafana 설치
◦
grafana 는 3000 포트를 점유합니다.
◦
따라서 보안그룹에서 자신의 IP 에 대해 3000 포트 open 정책을 추가합니다.
◦
초기 비밀번호 : admin / admin
$ sudo apt install grafana
Shell
복사
◦
ubuntu 20.04 인 경우
$ wget -q -O - https://packages.grafana.com/gpg.key | sudo apt-key add -
$ echo "deb https://packages.grafana.com/oss/deb stable main" | sudo tee -a /etc/apt/sources.list.d/grafana.list
$ sudo apt update
$ sudo apt install grafana
$ sudo service grafana-server start
Shell
복사
•
grafana 설정

•
configuration > datasource 메뉴에서 datasource 를 추가합니다.
•
Dashboards > Import > Grafana.com Dashboard 항목에 2587을 입력하고, datasource 로 influxdb 를 설정한 후 import 합니다.

D. 부하테스트
$ k6 run --out influxdb=http://localhost:8086/myk6db smoke.js
Shell
복사

2. 목푯값 구하기
A. 목표 rps 구하기
•
이미 수집하고 있는 정보가 있어, 피크타임대의 rps를 알고 있다면 그 정보를 활용하시면 됩니다.
•
•
경쟁사 정보를 벤치마킹할 수 없다면, 가설을 세우고 진행해봅니다. 가령, 1일 사용자수(DAU)와 피크시간대 집중률 (최대트래픽/평소트래픽), 그리고 1명당 1일 평균 요청수를 예상해봅니다.
◦
Throughput : 1일 평균 rps ~ 1일 최대 rps
▪
1일 사용자 수(DAU) x 1명당 1일 평균 접속 수 = 1일 총 접속 수
▪
1일 총 접속 수 / 86,400 (초/일) = 1일 평균 rps
▪
1일 평균 rps x (최대 트래픽 / 평소 트래픽) = 1일 최대 rps
B. VUser 구하기
•
Request Rate: measured by the number of requests per second (RPS)
•
VU: the number of virtual users
•
R: the number of requests per VU iteration
•
T: a value larger than the time needed to complete a VU iteration
T = (R * http_req_duration) + a
VUser = (목표 rps * T) / R
Plain Text
복사
•
가령, 시나리오상 두개의 요청 (R=2)이 있고, 요청별 평균 왕복시간이 0.5s, 부하테스트상에 고려하지 않았지만 현실세계에서 발생하는 지연시간이 1초(a)라고 가정할 때 VUser의 iteration별 목표 응답시간은 2입니다. 만약 이 때, 목표 rps가 300이라면, VUser는 300입니다.
VU = (300 * 2) / 2 = 300
즉 VUser 300으로 두고 테스트했을 때 요청별 응답시간을 0.5초 내를 달성한다면, 이 시스템은 300 rps를 보장한다고 이야기할 수 있습니다.